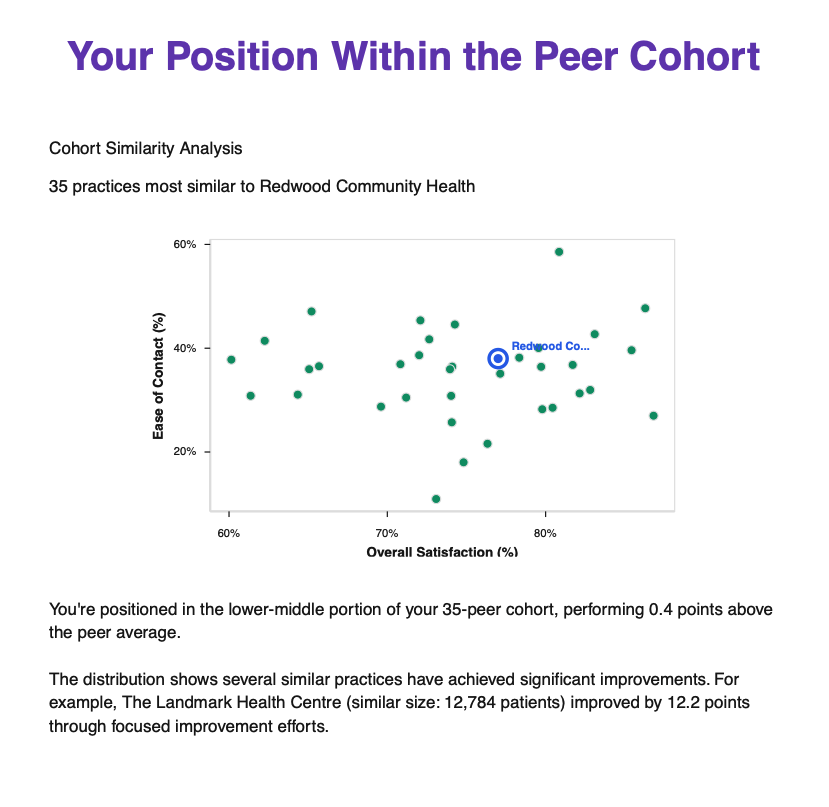
The annual GP Patient Survey results have landed. It’s the moment practice managers across the country simultaneously welcome and dread, offering a vital, nation-wide snapshot of patient experience.The first instinct for many is to jump straight to the national or even PCN average. "How do we stack up?" It’s a natural question, but is it the right one? Comparing your small, rural practice with a specific demographic to a giant, urban multi-site group, or even the national mean, is like comparing apples with oranges. It’s a benchmark, but it isn’t a guide. It tells you where you are, but not where you could realistically be.To turn survey data into a powerful tool for improvement, you need to go deeper than broad averages. You need to compare apples with apples.
The problem with broad benchmarks
Relying solely on national or PCN averages can be misleading and demotivating. These figures flatten the diverse reality of general practice in the UK. They don't account for the critical context that shapes your practice's performance, such as:
Practice size and capacity: A practice with 5,000 patients operates differently from one with 20,000.
Patient demographics: Factors like age, local health challenges, and deprivation levels significantly influence patient needs and survey responses.
Geographic context: An inner-city practice faces different access challenges than a remote, rural one.
Your starting point: Your improvement journey is unique. A practice scoring 65% has a different set of challenges than one starting at 85%.
When targets are based on these mismatched comparisons, they can feel irrelevant and unachievable. For meaningful change, you need insights grounded in the performance of practices genuinely like yours.
A better approach: A three-step peer performance audit
Instead of a simple comparison, conduct a strategic audit of your results with "peer intelligence" at its core. This means focusing on the performance of similar practices to set credible targets and identify proven improvement strategies.
Step 1: Identify your true peer cohort
The foundation of a fair analysis is identifying a cohort of 30-40 practices that genuinely reflect your own operating environment. Forget the national league table; this is about creating your own. Look for practices with similarities in:
Practice list size
Patient demographics (e.g., age profile)
Geographic context (e.g., urban, rural, town/fringe)
Baseline performance from previous surveys
Finding this data can be time-consuming, but it’s the only way to establish a truly credible benchmark. Once you have your cohort, you can see the full range of what’s being achieved, from the median performers to the top-quartile leaders.
Step 2: Analyse what drives their performance (and yours)
With a relevant peer group established, you can move beyond headline scores and dig into the "why." Look for patterns that distinguish the top-performing practices within your specific cohort.
Analyse access channels: How does your performance for phone, online, and in-person access compare to your peers? If the top 10% of your peers excel at phone satisfaction, that’s a powerful clue. Are their usage patterns different from yours?
Trace the patient journey: Break down the experience from making an appointment to the consultation itself. Where in this journey do the high-achieving peer practices outperform you? They might have similar appointment availability but a significantly better experience during the consultation. This pinpoints where to focus your efforts.
Find the key drivers: Look at the data to see which questions most strongly correlate with "overall satisfaction" for your peer group. For some cohorts, it might be the ease of getting through on the phone; for others, it could be feeling listened to during the consultation. This statistical insight is crucial for prioritising what to fix first.
Step 3: Set realistic, evidence-based targets
Now you can set goals that are both ambitious and achievable. Instead of chasing a generic national average, you can base your targets on what practices like yours have already accomplished.This approach transforms the conversation with your team.
Instead of: "The national average is 75%, and we’re at 68%. We need to improve."
You can say: "We’ve identified 35 practices very similar to ours. We rank 25th in this group. The top five performers score between 78-82%. Their phone access scores are the biggest differentiator. Let's aim to reach the peer median of 74% in the next year by focusing on that channel."
This is a credible, motivating story backed by relevant data. It provides your team with the reassurance that "if they can do it, we can too."
Let us do the heavy lifting for you
We understand that practice managers are busy professionals. This level of in-depth analysis is powerful, but it requires time and resources that you may not have.That’s why we’ve developed the My Practice Manager GP Survey Peer-Intelligence Report.Our report automates this entire process. We use sophisticated analysis to identify your unique peer cohort and transform the raw survey data into a strategic action plan. The report benchmarks your practice across every key area—from access channels to patient journey stages—against those who matter most: your true peers. We show you where you stand, what the top performers in your cohort are doing differently, and which improvements statistically correlate with the biggest gains in satisfaction.You can see an example of what the report delivers here.Stop comparing your practice to national averages that don't fit. Start making decisions based on credible, relevant, and actionable peer intelligence.If you'd like our help in this analysis, email us at gp-survey-analysis-report@mypracticemanager.co.uk.
Disclaimer: This article is for informational purposes only and reflects understanding as of 16 July 2025. It does not constitute legal, financial, or medical advice. Practices should consult with relevant professional bodies or legal counsel for specific circumstances and always refer to the latest official NHS England (and other relevant bodies) guidance and contractual documents.
